Excel / Business Analytics
Store Sales Excel Dashboard
Annual store sales report with cleaned customer data, interactive slicers, and actionable revenue insights
12
Monthly Trend
Orders and sales over time
Top 5
Sales Regions
State-level contribution analysis
3
Age Segments
Teenage, adult, senior customers
Excel
Interactive Report
Slicers for month, channel, category
What It Does
This project turns raw store order data into an annual sales dashboard for business decision-making. The workbook cleans inconsistent customer fields, derives useful reporting dimensions, and visualizes performance across month, gender, age group, region, channel, order status, and category.
The final report is designed for stakeholder exploration: slicers let users filter the dashboard by month, sales channel, and product category so the same workbook can answer multiple business questions without rebuilding charts.
Data Preparation
Gender standardization: Normalized mixed labels such as M, Men, W, and Women into consistent Men and Women values.
Quantity cleanup: Resolved inconsistent numeric and text values so order quantities could be aggregated reliably.
Age group creation: Bucketed customers into Teenage, Adult, and Seniors segments to compare purchase behavior by life stage.
Month extraction: Derived month from the Date column to identify seasonal peaks and monthly revenue movement.
Dashboard Preview
Excel report screenshot from the project repository
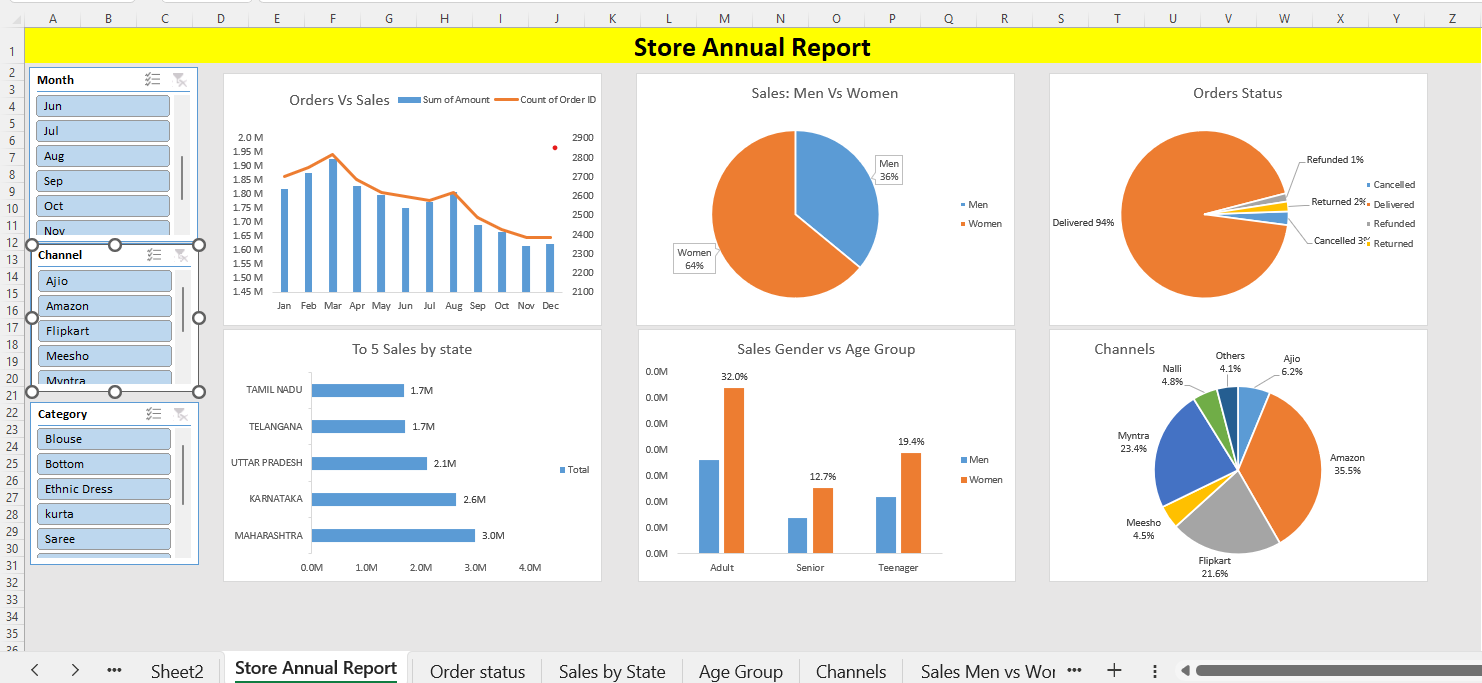
Monthly sales, status mix, channels, top regions, and customer segments
Open imageBusiness Questions Answered
Highest Sales Month
Monthly order and sales charts reveal the period with the strongest revenue performance.
Gender Purchase Split
A percentage chart compares total sales contribution from men and women customers.
Top Sales Regions
State-level bar charts identify the top 5 regions driving store sales.
Age Group Behavior
Age-group analysis shows which customer segment contributes the most orders and sales.
Channel Contribution
Channel slicers and charts show which platforms contribute the most to sales revenue.
Category Performance
Product category filters help identify the strongest-selling category mix.
Key Insights
Women drove more purchases
The gender split shows women as the stronger customer segment for this store.
Adults contributed the most sales
The adult segment, roughly ages 35-50, produced the highest sales contribution.
Amazon led channel performance
Amazon emerged as the top-performing channel, with Flipkart also recommended for ad focus.
Recommended Action
Prioritize marketing toward women customers aged 30-49 in high-performing states such as Maharashtra, Karnataka, and Uttar Pradesh, with paid campaigns focused on Amazon and Flipkart.
Skills Demonstrated
Data Cleaning
Standardized inconsistent categorical and numeric fields to prepare raw store data for analysis.
Excel Dashboarding
Built interactive charts and slicers for month, channel, and category filtering.
Customer Segmentation
Created derived age-group dimensions to analyze customer behavior and sales contribution.
Business Storytelling
Translated chart outputs into clear recommendations for customer targeting and channel spend.